What Month Has the Highest Trucking Rates?
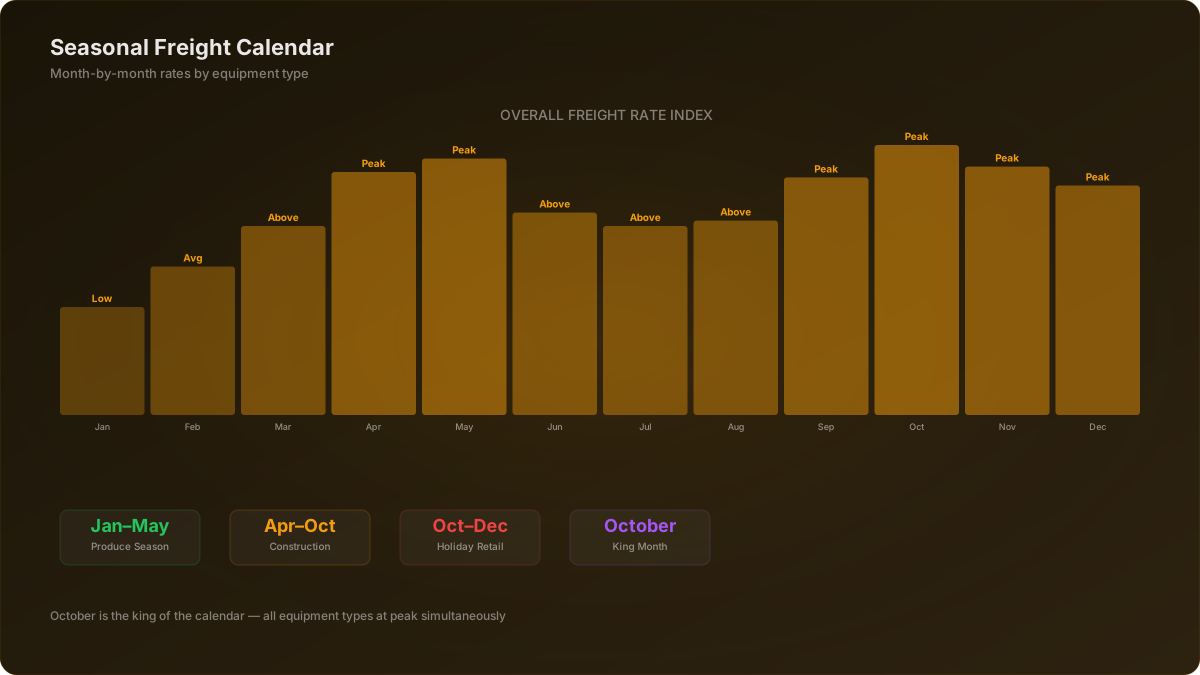
October, for dry van, flatbed, and hopper. Three demand drivers land in the same four weeks: the Midwest grain harvest moving corn and soybeans out of the fields, holiday imports flowing from the ports into distribution centers, and retail restocking ahead of Black Friday. Capacity gets genuinely tight, and carriers with available hours have the leverage in a rate conversation. November holds most of that strength, and the first half of December keeps it going before the market drops off after Christmas.
Refrigerated freight is the exception to the October rule. Reefer follows the produce calendar, not the retail calendar, so its national peak comes six months earlier — in April and May, when Florida, Georgia, the Carolinas, and California are all shipping simultaneously. If you run reefer, October is a good month, not your best one. That single distinction is the most commonly misunderstood part of the freight calendar.
The slowest stretch is January through mid-February, plus the week between Christmas and New Year. If you want the live market read on top of this seasonal baseline, the freight market indicators guide covers which numbers actually move rates week to week. This article is part of our freight rates and markets guide.
Why Freight Rates Change Month to Month
Freight doesn't move at the same pace year-round, and understanding why is the foundation of planning your year. The single biggest driver of seasonality is agriculture. Produce ships out of South Florida through the winter and migrates northward through the spring and summer — tomatoes, strawberries, onions, peaches, cherries, apples — each crop creating a wave of reefer demand that follows the harvest north. By the time Florida winds down in May, Georgia is peaking, and by the time Georgia slows, Washington cherries are getting started. This northward produce migration is the most predictable seasonal pattern in trucking, and the produce season trucking guide covers how to run those loads once you are in the market.
Construction is the second major seasonal force. Ground-breaking, road work, and building projects require large volumes of steel, lumber, concrete, heavy equipment, and prefabricated materials — all of which move on flatbed, step deck, and heavy haul. Construction follows weather: it starts earliest in the South in February and March, peaks nationwide in summer, and contracts in northern states by November. That produces a flatbed rate curve that mirrors the construction calendar closely.
Retail is the third force, and it dominates the fourth quarter. Holiday shopping drives a large surge in dry van freight from September through December as imported goods flow from ports to distribution centers and then to stores. That Q4 retail wave is why October and November carry the highest dry van spot rates of the year. Layer in weather — winter storms that strand trucks, spring flooding that closes lanes, and Gulf hurricane season — and you have a market that shifts meaningfully month to month. Carriers who understand these patterns and position ahead of them can consistently be working in higher-demand markets than carriers who simply take whatever loads come their way.
Month-by-Month Freight Calendar: What Ships When
Below is a month-by-month breakdown of what drives freight demand, which regions are active, and which equipment types are in the strongest position. Use it as a planning guide for when and where to position your truck through the year. For the spring lanes specifically, the best freight lanes for spring 2026 goes deeper on origin-destination pairs.
January
Below AvgJanuary is the quietest month on the freight calendar for most equipment types. The post-holiday slowdown hits dry van hardest — retailers overstocked during Q4 and are now working through inventory rather than ordering more. Flatbed is nearly dormant as winter weather halts construction projects across the northern half of the country. The bright spot is South Florida, where produce season is already running. Reefer demand rises steadily as tomatoes, peppers, strawberries, and early citrus shipments ramp up out of Homestead, Immokalee, and Plant City. If you run reefer, head south. If you run dry van, use January for maintenance, tire replacements, and your annual DOT inspection while rates are low.
February
AverageFlorida produce season is in full swing, pushing Southeast reefer rates to their regional high for the year. Strawberries out of Plant City, tomatoes from Homestead, and bell peppers from Immokalee are all shipping heavy volume. The Rio Grande Valley in Texas is moving citrus and vegetables. Meanwhile dry van is still sluggish nationally, though you will see slight improvement as some shippers begin spring inventory planning. Oilfield activity in the Permian Basin typically restarts after the holiday slowdown, creating flatbed and heavy haul demand in West Texas and eastern New Mexico. Construction remains minimal in the Midwest and Northeast due to weather.
March
Above AvgMarch is the inflection point where freight starts moving upward. Florida produce hits peak stride — blueberries join the mix alongside continued tomato and pepper shipments. The Rio Grande Valley is shipping citrus and vegetables at high volume. Spring weight restrictions begin in the Upper Midwest (Minnesota, Wisconsin, Michigan, the Dakotas), limiting axle weights on rural roads and creating capacity constraints as some carriers avoid affected states. Minnesota DOT set its 2026 restrictions from March 3 in the Metro, South, and Southeast zones through March 20 in the North zone, running as late as May 15. Construction materials begin moving as the thaw hits the mid-South and mid-Atlantic. Dry van improves noticeably as retailers begin their spring inventory push.
Source: MnDOT 2026 spring load restrictions
April
PeakApril is where the freight calendar gets serious, and it is the start of the national reefer peak. Florida blueberries, Georgia Vidalia onions, California strawberries, and Carolinas early crops all ship simultaneously, and refrigerated demand in the Southeast outstrips the trucks available to cover it. Flatbed hits its stride as construction season gets underway from the mid-South through the Northeast — road projects, bridge work, and commercial building all require steel, lumber, concrete, and heavy equipment. Dry van benefits from spring retail and general freight increases. This is the first month of the year where all three major equipment types see strong rates at the same time. If you are going to reposition for seasonal advantage, April is the month to be in the Southeast or California.
May
PeakMay is the second half of the reefer peak that began in April, and taken together those two months are the strongest stretch of the year for refrigerated equipment. Georgia peaches and blueberries, Carolinas spring crops, and the tail end of Florida shipments keep reefer demand elevated. Central California enters its busiest period with lettuce, broccoli, cauliflower, and early stone fruit. Flatbed remains strong as construction runs at full pace across most of the country and the residential building season drives lumber and materials demand. Dry van continues to improve as summer retail inventory building begins — outdoor furniture, garden supplies, grills, and seasonal merchandise all move from warehouses to stores. Capacity tightens across most major corridors.
June
Above AvgJune sees the produce calendar shift its center of gravity from the Southeast to California and the Pacific Northwest. Washington cherry season begins — cherries are among the most time-sensitive reefer commodities in the country, which supports strong rates during the harvest window. California stone fruit (peaches, nectarines, plums) and grapes begin shipping from the San Joaquin Valley. Southeast produce winds down as Georgia and the Carolinas finish their harvests. Construction remains at peak levels, keeping flatbed rates strong. Automotive plants are typically in full production, generating consistent dry van freight from manufacturing hubs in Michigan, Ohio, Kentucky, Indiana, and Tennessee. June is solid across all equipment types, though Southeast reefer rates ease as produce moves west.
July
Above AvgJuly presents a mixed picture. Washington cherries are at peak volume, California grapes and stone fruit are shipping strong, and summer produce keeps reefer respectable — though nationally this is the start of reefer's softest stretch as spring produce finishes and fall crops have not begun. Construction is at its annual peak with the longest daylight hours allowing extended work schedules, so flatbed demand stays high. Many automotive plants schedule their summer shutdown for model-year changeover and planned maintenance in July, and the timing and length vary by manufacturer and year. That shutdown can soften dry van rates on Midwest lanes that depend heavily on auto parts and finished vehicle components. The Independence Day holiday also creates a short disruption in freight movement.
August
Above AvgAugust is the bridge between summer freight patterns and the fall surge. Late-summer produce continues from California and the Pacific Northwest, and Washington apples begin their harvest. Back-to-school retail creates a noticeable uptick in dry van freight as clothing, electronics, supplies, and furniture ship to stores and dorms across the country. This is often the first clear sign of the Q4 freight wave building. Construction remains strong but some projects begin wrapping up in anticipation of fall. Carriers who plan ahead start pre-positioning for the Midwest harvest — grain elevators, ethanol plants, and agricultural processors in Iowa, Illinois, Indiana, Ohio, and Nebraska will need significant truck capacity starting in September.
September
PeakSeptember marks the beginning of the fall freight surge — the most intense and sustained period of high demand on the calendar. The Midwest harvest kicks off in earnest as corn, soybeans, wheat, and other grains move from fields to elevators, processors, and export terminals, creating heavy demand for hopper trailers and dry van in rural Midwest corridors. Simultaneously, holiday import season ramps up at the major ports — Los Angeles/Long Beach, Savannah, Charleston, Newark, and Houston see container volumes climb as retailers receive goods ordered months earlier. Those containers need to be drayed to warehouses and then distributed inland, creating cascading demand across intermodal, dry van, and reefer. Rates across most equipment types begin climbing and generally continue upward through November.
October
PeakOctober is the strongest month of the year for dry van, flatbed, and hopper freight, because three demand drivers converge at once. The Midwest harvest is in full swing with corn and soybeans moving at maximum volume. Holiday import freight from the ports is filling distribution centers nationwide as retailers stock shelves before Black Friday. And general retail restocking hits its annual high as consumer spending ramps toward the holidays. Reefer is the exception to the October story — it already had its national peak in April and May, though California ships year-round and holiday food freight starts adding reefer demand late in the month. Flatbed benefits from the final push of construction before winter, plus heavy equipment moves as projects wrap up. Capacity is genuinely tight in October: if you are on the road with available hours, you are in a strong position to negotiate.
November
PeakNovember sustains the October peak with some shifts in composition. Holiday retail freight is at its zenith — Black Friday, Cyber Monday, and the Thanksgiving-to-Christmas shopping rush create relentless demand for dry van capacity from distribution centers to retail locations. The Washington apple harvest wraps up, ending one of the longest produce seasons in the country. The Midwest harvest winds down as fields empty, though grain transport to export terminals and processors continues. Flatbed begins its seasonal slowdown as construction projects close for winter in the northern states, while Texas, Florida, and the Carolinas maintain activity. Thanksgiving week itself creates a mini-disruption: many drivers take time off, which tightens capacity further and supports elevated rates for carriers who keep running.
December
Peak, Then CrashDecember is a tale of two halves, and the split matters more than the monthly average. The first two to three weeks maintain the holiday freight rush — retailers making final inventory pushes, e-commerce fulfillment running at maximum speed, and last-minute seasonal shipments keeping dry van and reefer elevated. That is especially true for reefer carriers hauling holiday food: turkeys, hams, dairy, baked goods, and beverages ship at premium rates to grocery chains and food distributors. Then Christmas hits and the freight market falls off a cliff. The week between Christmas and New Year is one of the deadest periods in trucking — shippers close, warehouses run skeleton crews, and load boards thin out dramatically. Rates crater. Plan late December for home time, maintenance, and tax preparation. The cycle resets in January.
Best and Worst Months by Equipment Type
Different equipment types follow different seasonal curves. Knowing your equipment's best and worst months lets you plan maintenance, home time, and repositioning moves strategically rather than reactively. The table below is a qualitative planning baseline built from the patterns described in this article — it shows relative demand, not measured rates. For an actual rate figure on a specific lane, use the rate per mile calculator.
| Equipment | Jan | Feb | Mar | Apr | May | Jun | Jul | Aug | Sep | Oct | Nov | Dec |
|---|---|---|---|---|---|---|---|---|---|---|---|---|
| Dry Van | Low | Low | Avg | Above | Above | Above | Avg | Above | Peak | Peak | Peak | Mixed |
| Reefer | Avg | Above | Above | Peak | Peak | Above | Low | Low | Avg | Above | Above | Above |
| Flatbed | Low | Low | Avg | Above | Peak | Peak | Peak | Above | Above | Above | Avg | Low |
| Step Deck | Low | Low | Avg | Above | Peak | Peak | Peak | Peak | Peak | Above | Avg | Low |
| Hotshot | Steady | Steady | Steady | Steady | Steady | Steady | Steady | Steady | Steady | Steady | Steady | Steady |
| Heavy Haul | Low | Low | Avg | Above | Above | Peak | Peak | Peak | Peak | Above | Avg | Low |
Peak = strongest demand of the year · Above = above typical · Avg = typical · Low = weakest · Mixed = strong then sharply weaker within the month · Steady = event-driven rather than seasonal.
Dry Van
Dry van follows the retail calendar closely. Rates bottom out in January when retailers are working through holiday inventory and shippers are budgeting for the new year. The slow climb begins in March, accelerates through back-to-school in August, and peaks from October through the middle of December. The window closes hard: once Christmas passes, dry van demand collapses for the last week of the year, so treat the strong period as October to mid-December rather than the full quarter.
Reefer
Reefer has the most distinct seasonal pattern of any equipment type because it follows agriculture rather than retail. The strong window is February through June, and the national peak falls in April and May when Florida, Georgia, the Carolinas, and California all ship at once. A second, smaller peak arrives from October through December on holiday food freight — turkeys, hams, dairy, and baked goods. July and August are the soft spot, between summer produce winding down and fall shipments ramping up.
Flatbed
Flatbed is the most weather-dependent equipment type. When the ground thaws and construction begins, flatbed rates rise. When snow flies and building stops, rates drop. The peak window is April through October when construction activity, road projects, and infrastructure work are in full swing. Southern flatbed carriers run a longer season because construction continues year-round in Texas, Florida, and the Gulf states.
Step Deck
Step deck follows the construction calendar but specifically tracks heavy equipment and oversized loads. Excavators, bulldozers, cranes, industrial components, and prefabricated structures all move on step deck trailers, and demand peaks when large-scale projects are active in summer. Wind farm construction has become a significant step deck market, with tower sections and nacelles moving from manufacturing plants to installation sites during the summer construction window.
Hotshot
Hotshot is less seasonal and more event-driven, which is why it reads as steady across the whole calendar rather than peaking in any particular month. Emergency freight, expedited parts, and oilfield servicing create demand throughout the year. Hotshot demand tracks drilling activity in the Permian Basin, Eagle Ford, and Bakken more closely than it tracks the seasons, so watch rig counts rather than the calendar. Hotshot is also the go-to for expedited shipments that cannot wait for standard scheduling — a broken-down production line needing a part overnight pays a premium regardless of the month.
Heavy Haul
Heavy haul is the most permit-dependent and weather-sensitive equipment category. Oversize and overweight loads require state permits, pilot cars, and often route surveys — all of which are easier to obtain and execute in summer. Wind farm construction (turbine blades, tower sections, nacelles) has become a major heavy haul market during the summer construction window. Infrastructure projects including bridge beams, transformer units, and industrial equipment also concentrate in warm months when road conditions allow oversized transport.
Not sure which season your truck should be chasing?
Our dispatchers watch the produce calendar, harvest timing, and construction season so your truck is in the right market before demand peaks — not after everyone else has already repositioned.
Talk to a dispatcherWhen Does Produce Season Start? Regional Produce Calendar
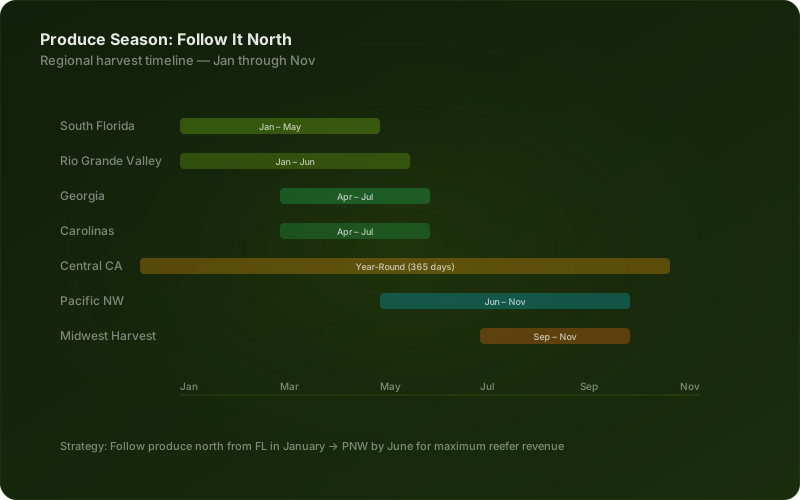
Produce season runs roughly January through July and moves south to north. Here is when each major agricultural region ships and which commodities drive reefer demand. Following this calendar northward is the backbone of a reefer year — the produce season trucking guide covers the load-level detail, and the interstate corridor guide maps the lanes that connect these regions.
South Florida
January - MayThe freight year begins here. Homestead, Immokalee, and Plant City are the epicenters, and several of these crops are already shipping by late autumn, so January finds the region in full stride rather than just starting. Reefer demand builds through the winter and peaks in March and April. Miami and Fort Myers are the primary origin markets, and northbound Florida lanes (FL to ATL, FL to the Northeast) are where reefer demand concentrates during this window.
Rio Grande Valley, TX
January - JuneThe Valley ships overlapping with Florida, creating dual-source reefer demand in the first half of the year. McAllen, Weslaco, and Edinburg are key origins. Cross-border produce from Mexico also transits through Laredo and McAllen, adding to reefer demand. Texas-to-Midwest and Texas-to-Northeast lanes are consistently active during this period.
Georgia
April - JulyGeorgia bridges the gap between Florida winding down and the mid-summer produce season. Vidalia onions are the signature crop and they ship in a short, concentrated spring window that creates intense short-term reefer demand — the name is a protected designation tied to a defined South Georgia production area, and the pack date that opens each season is set annually rather than being fixed. Georgia peaches follow immediately. Tifton, Vidalia, and Fort Valley are the primary origin points, and GA-to-Northeast lanes are the ones to watch in April and May.
Central California
Year-round (365 days)The San Joaquin Valley and Salinas Valley are among the most productive agricultural regions in the United States, and they ship every day of the year. The California Department of Food and Agriculture reports that the state produces nearly half of the country's vegetables and over three-quarters of the country's fruits and nuts, on $61.2 billion in farm cash receipts for the 2024 crop year. The Salinas Valley ships lettuce and leafy greens year-round. Stone fruit peaks in June through August and grapes ship July through November. There is never a dead period for reefer in California, which makes it the most consistent produce market in the country.
Source: CDFA California Agricultural Statistics (2024 crop year)
Carolinas
April - JulyNorth Carolina is a leading sweet potato state, and while the harvest runs in the fall, sweet potatoes ship from controlled-atmosphere storage year-round — so do not expect them to drive a spring surge. The spring and early summer window here is peaches, blueberries, and watermelons. Eastern North Carolina (Benson, Clinton, Nashville) and South Carolina (Edgefield, Ridge Spring) are the key origin markets.
Pacific Northwest
June - NovemberWashington state is the anchor of Pacific Northwest produce. Cherry season (June to August) is among the most time-sensitive reefer work in the country — cherries are cooled and moved very quickly after picking, and that urgency supports strong rates through the harvest window. Washington apples run one of the longest produce seasons in the country, from August into November, providing sustained reefer demand for months. The Yakima Valley, Wenatchee, and the Columbia Basin are the primary origin markets.
Midwest
September - NovemberThe Midwest harvest is less of a reefer event and more of a dry van, hopper, and grain trailer event — but the volume is enormous. Iowa, Illinois, Indiana, Ohio, Minnesota, and Nebraska harvest corn and soybeans that must move from fields to grain elevators, ethanol plants, feed lots, and export terminals. This creates heavy demand for truck capacity in rural corridors from September through November, coinciding with the Q4 retail surge to produce the tightest capacity of the year.
How to Position Your Truck for Seasonal Peaks
Understanding the calendar is only half the equation. The value comes from acting on it — positioning your truck in the right market before demand peaks rather than after. Here are four strategies worth planning around.
Follow the Produce North
If you run reefer, this is the most predictable planning move available to you. Start in South Florida in January. As Florida produce winds down in April and May, reposition to Georgia for Vidalia onions and peaches. By June, move to California for stone fruit and to the Pacific Northwest for cherries. August through November keeps you in Washington for apples. The point of the migration is that it keeps your truck in the markets where refrigerated demand is highest, month after month, instead of chasing whatever posts near you. Carriers who plan the route in advance get better lanes than carriers who react to the load board.
Pre-Position for Harvest Season
The Midwest harvest creates heavy demand from September through November, and the best freight goes to carriers who are already in the region when it spikes. If you run dry van or hopper, plan to be in Iowa, Illinois, Indiana, or Nebraska by late August. Taking a cheaper load to get into position can be worth it — but run the numbers before you commit, because whether the harvest premium covers the repositioning depends on your cost per mile and how far you are moving. Grain elevators, ethanol plants, and agricultural processors often book capacity in advance with carriers they know are local and available.
Run the repositioning cost through the deadhead calculator before you commit, and read how to avoid deadhead miles for ways to get paid on the move.
Build Broker Relationships Before the Peak
When rates peak in October, every carrier is calling the same brokers for the same loads. The carriers who get preferred access to the best freight are the ones who built the relationship during the slow months. Use January and February to reach out to brokers in the regions you plan to work during peak season. Move a few loads at decent, not great, rates to prove your reliability. When October arrives and that broker has ten carriers calling, you want to be the one they already trust. This applies to every peak — produce, construction, and retail.
Use Slow Months Strategically
January and February are the slowest months for most equipment types, and most carriers treat that as a problem. Treat it as scheduling leverage instead. Book your annual DOT inspection, replace worn tires, run preventive maintenance, update your insurance, file your IFTA return, and renew your permits during the slow season, when sitting in a shop costs you the least forgone revenue. Every day your truck is down in October costs materially more than the same day in January. Plan your downtime for when the freight market pays you the least for your uptime.
Two things worth booking into that window: the annual DOT inspection and your IFTA filing.
Sources
Seasonal demand patterns in this article are qualitative planning guidance drawn from how agriculture, construction, and retail schedules drive freight. They are not rate index readings. The dated regulatory and production figures cited above come from these primary sources:
- Minnesota DOT — Seasonal Load Limits — 2026 spring load restriction start and end dates by frost zone.
- California Department of Food and Agriculture — Statistics — California share of US vegetable and fruit-and-nut production and 2024 farm cash receipts.
Related Resources
- Freight Rates & Markets — The pillar guide this calendar belongs to, covering rate mechanics, indicators, and negotiation
- Regional Freight Guides — Deep dives into freight patterns for every major US region
- How to Avoid Deadhead Miles — Reduce empty miles between seasonal repositioning moves
- Deadhead Calculator — Calculate the true cost of repositioning to a seasonal market
- Rate Negotiation Tips — How to maximize your rate once you are in a peak market
- Produce Season Trucking Guide — Complete guide to running reefer loads during produce season
- Hurricane Season Freight Guide — How Gulf storms disrupt the late-summer freight calendar
- 2026 Industry Forecast — Market trends and rate outlook for the year ahead
- Weekly Revenue Calculator — Track your revenue through peak and slow seasons to see the real seasonal swing
- Reefer vs Dry Van Profitability — Which trailer type suits your operation across the seasonal cycle
- Supply Chain Disruption Guide — What to do when seasonal patterns get disrupted